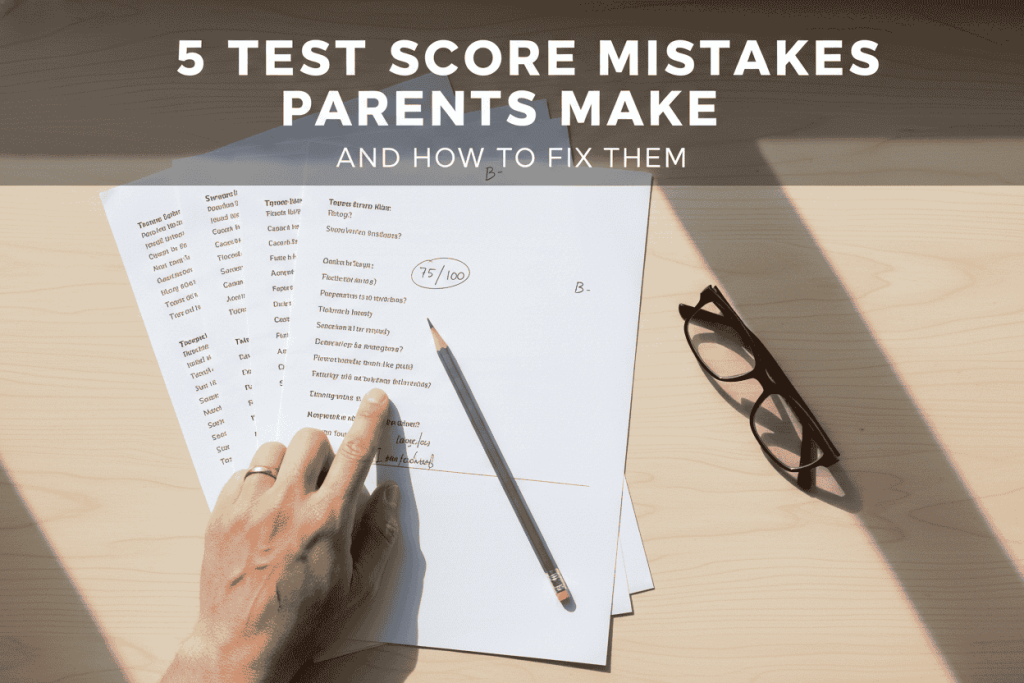
Your child’s test comes home. You look at the number. And before you’ve even set down your keys, you’ve already formed an opinion.
Most of the time, that opinion is based on a misread.
This isn’t a reflection of how much you care. It’s a reflection of how confusing test reports actually are. A 2024 University of Chicago study confirmed what many teachers already know: standardized test data is genuinely difficult for parents to interpret. Reports come packed with percentile ranks, grade equivalents, scale scores, and raw percentages. But schools rarely explain the difference between any of them.
The result: Parents with the best intentions regularly draw the wrong conclusions. They panic when there’s no reason to. They stay calm when action is actually needed. They punish when they should support. They compare when they should focus on growth.
According to research on how parents interpret grades versus test scores, nearly 60% of student grades don’t match their standardized test performance — leaving parents receiving conflicting signals with no framework to make sense of them.
This guide explains the five biggest test score mistakes parents make and shows how to fix them—helping you support your child without added stress.
Before You Read a Score: Know What You’re Looking At
Standardized test reports usually show three score types, each measuring something different and used for different purposes. Most mistakes happen when parents treat them as interchangeable, but they’re not. Most test score mistakes happen before parents even process the number. They occur because parents don’t realize which type of score they’re looking at.
Test reports typically include three types of scores. Each tells you something different.
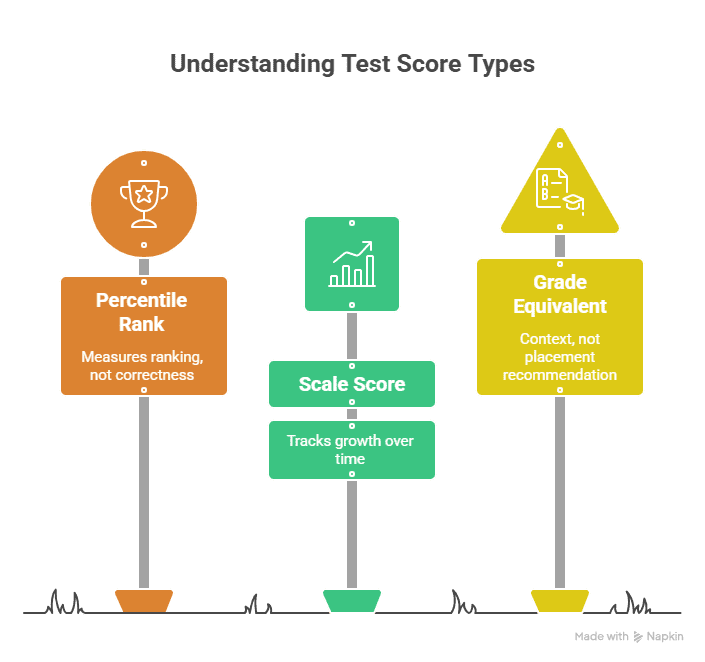
Percentile Rank (example: 72nd percentile) is a comparison score. It tells you how your child performed relative to other students who took the same test. A 72nd percentile means your child scored better than 72% of those students. It measures ranking, not correctness.
Scale Score or Standard Score (example: RIT 218) is a growth score. It measures actual learning on a continuous scale that doesn’t reset by grade level. This is the best number for tracking improvement over time. If your child’s scale score grows from one test to the next, real learning happened — regardless of what percentile that puts them in.
Grade Equivalent (example: 5.8) is the most misread score type. A grade equivalent of 5.8 for a 3rd grader does not mean your child is ready for 5th grade. It means they performed the way an average late-5th grader would perform on a 3rd grade test. It’s context, not a placement recommendation.
The rule: use percentile rank for peer comparison. Use scale score for growth tracking. Treat grade equivalent as background context only. With that foundation in place, here are the five mistakes to stop making.
Mistake #1: Confusing Percentile Rank with Percentage Score
Percentile rank and percentage score look similar, but they measure completely different things. A 68th percentile is not a 68% grade. This visual shows exactly how they differ and why the distinction changes how you respond to a test result.
This is the most widespread misread in parent-teacher conferences everywhere. A parent sees “62nd percentile” and thinks: 62%. That’s almost a D. They’re upset. They call the teacher. It turns out their child is performing better than 62% of students nationally.
Percentile rank and percentage score are completely different numbers. A percentage score tells you how many questions your child answered correctly. A percentile rank tells you how your child compares to peers.
Here’s a real example of how they can diverge. A child can score 68% correct on a test and still land in the 80th percentile — if the test was genuinely difficult and most students scored lower. A child can score 90% correct and still land in only the 55th percentile if the test was easy and most students scored high. Neither number is wrong. They’re just measuring different things.
How to fix it: Before reacting to any score, ask one question: Is this a ranking or an accuracy score? Check the report header or ask the teacher. Once you know which type you’re reading, the number makes sense immediately.
A quick reference:
- 1st–25th percentile → below average; worth a conversation
- 25th–75th percentile → typical, normal range
- 40th–60th percentile → right around the national average
- 75th–99th percentile → above average performance
⚡ Still unsure where percentages end and percentiles begin? The difference between percentage scores and percentile ranks gives the full picture and clears up the confusion in one read.
If you want to convert your child’s raw score into an actual percentage quickly, running it through a test grader gives you the number in seconds. No math calculations are required.
Mistake #2: Misinterpreting Grade Equivalent Scores
A 4th grader brings home a score report showing “6.2” as their grade equivalent. The parent is thrilled. They start talking to the school about grade skipping. This is a very common mistake and an understandable one.
A grade equivalent of 6.2 for a 4th grader does not mean the child is performing at a 6th grade level. It means they performed the way an average 6th grader would on a 4th grade test. The test questions were still 4th grade material. The child just did exceptionally well on them.
The same misread happens in the other direction. A 5th grader scoring “3.8” as a grade equivalent doesn’t necessarily mean they’re two years behind. It means the child performed on this test the way a 3rd grader would. That could indicate they had a rough day, the test covered material not yet taught, or there’s a genuine skill gap. One data point doesn’t tell you which.
How to fix it: Don’t make major academic decisions based on grade equivalents alone. For a clearer picture, focus on:
- Percentile rank for peer comparison
- Scale scores for growth over time
- Classroom performance for day-to-day skill evidence
If a grade equivalent looks extreme in either direction, bring it to the teacher. Ask: “What does this score actually mean for where my child is right now?“ That question gets you much further than the number alone.
Mistake #3: Reacting Immediately Without Context
The grade comes in. The parent reacts within minutes. Phone gets taken. Privileges get removed. The child gets a lecture about effort.
Here’s the problem. That immediate reaction almost always happens before any context has been gathered. Was it a hard test? Was the class average a 58? Did the child have a migraine that morning? Was material on the test not yet covered in class?
Parents who react quickly without asking those questions first often end up overreacting. A single data point rarely represents a real pattern. And the research is clear on what that does to kids. A 2024 meta‑analysis in the Journal of School Psychology, covering more than 20 studies, found that test anxiety is directly linked to lower academic self‑concept and reduced performance. One of the key drivers of test anxiety in children is negative parental response to test results.
One reactive conversation can plant a seed that makes the next test harder, not easier.
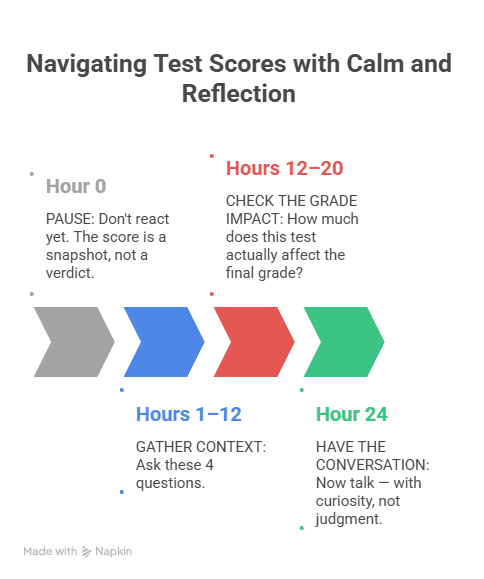
How to fix it: Give yourself 24 hours before responding to a test score. In that window, find out:
- Is this one result or part of a pattern across multiple tests?
- What does the teacher say about how the class performed?
- What does your child say about how they felt during the test?
- Were there any outside factors — illness, stress, a disrupted week?
A single test is a snapshot. Three tests across a semester showing the same pattern is something to act on. One test is not enough information to draw conclusions from. Understanding how much a single test actually affects the overall course grade is important. The weighting of each assignment type on your child’s syllabus often shows that one rough test moves the needle far less than parents fear, especially when other assignments carry heavier weight.
Mistake #4: Ignoring Classroom Performance When Test Scores Are Low
Your child has been earning A’s and B’s all semester. Then a standardized test result arrives showing the 35th percentile. Something doesn’t add up. Your first instinct might be: Are the grades inflated? Is my child really struggling?
Sometimes that concern is valid. But often, the gap between classroom grades and test scores has a completely different explanation. Three common reasons this happens:
Test anxiety. Your child knows the material but performs below their ability under timed, high-stakes conditions. A 2024 systematic review in the Journal of School Psychology found that test anxiety lowers academic achievement. Students do not fail because they lack knowledge. Anxiety interferes with recall and performance. The effect is especially strong in math.
Curriculum misalignment. Standardized tests measure broad national standards. Your child’s class may have covered the same topics in a different sequence or with a different emphasis. Strong classroom grades reflect what was taught. Standardized scores reflect what was tested.
Different skills assessed. Classroom grades often reflect project work, participation, written assignments, and collaborative tasks. Standardized tests measure different skills. They usually focus on timed recall and multiple‑choice reasoning. Some students genuinely excel in one format and struggle in the other.
How to fix it: Schedule a teacher conference before drawing conclusions. Ask specifically:
- “Is this gap common in the class or unusual for my child?”
- “Do you see the same level of understanding in daily work?”
- “Are there signs of test anxiety I should watch for?”
Also look at how individual test scores connect to the final course grade. Using a syllabus-based grade calculator shows how each assignment type is weighted. Parents often see that standardized test results and classroom grades can coexist without one invalidating the other. They’re measuring different things. If test anxiety seems to be a factor, a school counselor is the right starting point. Additional test prep is not the solution.
Mistake #5: Comparing Your Child to Siblings or Other Students
Your older child scored in the 88th percentile. Your younger child scores in the 54th. The comparison feels automatic. You say something or you don’t say it out loud but your child senses it anyway. Both things cause damage.
The 54th percentile is not a disappointing result. It means your child performed better than more than half of students nationally. That is average — and average is not failure. But when it’s placed next to an 88th percentile sibling’s result, it sounds like failure. And children internalize that.
Research on social comparison in academic settings is consistent: sibling comparison in particular increases anxiety, reduces intrinsic motivation, and shifts a child’s focus from learning to competition. The child stops asking “Am I improving?” and starts asking “Am I better than them?” Those are very different questions with very different effects on long-term learning.
How to fix it: Compare your child only to their own previous results. The only question worth asking is: Is my child growing over time?
A child who moves from the 42nd percentile to the 55th percentile over two years is doing something genuinely right. That progress is meaningful — regardless of where a sibling, classmate, or neighbor scores.
Create a simple rule at home: test scores are not shared competitively. Not between siblings. Not with relatives who ask. Not in ways that invite ranking. Growth is the only valid comparison.
For high schoolers, test scores connect to GPA and college applications. Understanding how GPA accumulates over time puts individual test results in perspective. One test rarely defines the picture. Four years do.
What to Do When Scores Are Genuinely Concerning
Everything above assumes occasional low scores in otherwise normal performance. But sometimes a pattern emerges that deserves real attention.
Act — not just observe — if your child:
- Consistently scores below the 25th percentile across multiple tests and subjects
- Shows a significant drop in scores compared to previous years
- Struggles both in classroom grades and on standardized tests simultaneously
- Completes tests much more slowly than peers or regularly runs out of time
One low score is a snapshot. Three or more low scores showing the same pattern is a signal.
The right response is a teacher conference first, then possibly a referral to a learning specialist. The school may recommend additional assessment for learning differences. The CDC reports that approximately 11.4% of U.S. children aged 3–17 have been diagnosed with ADHD and many go unrecognized for years, their focus struggles misread as effort or behavior problems rather than a neurological difference that responds to very different support. Getting an evaluation isn’t a judgment on your child. It’s information. And information is what parents actually need.
Can a Bad Test Score Be Fixed? What Parents Often Don’t Ask
Many parents focus entirely on the test score itself. They rarely ask the most practical follow-up question: How much does this actually affect my child’s final grade?
The answer depends on how the course is structured.
In most classrooms today, grades are weighted by category. A single test might represent 20–25% of the final grade. Strong homework performance, project scores, and upcoming assessments can absolutely offset a poor result. In some cases, extra credit opportunities can shift the final number too — though usually by less than parents expect.
Before assuming a bad test is a disaster, it’s worth understanding the math. Calculating exactly how much extra credit would raise a final grade takes two minutes and gives you a real number to work with. That real number makes conversations with teachers much more productive than assumptions do.
The same applies to calculating a final grade from syllabus weightings. This shows exactly where the grade stands and what movement is possible before the semester ends.
A Better Approach: The Framework That Works
Most parental reactions to test scores happen before any context has been gathered. This 24‑hour framework slows the process down not to avoid action, but to ensure the response is thoughtful. The goal is to make sure the action taken is the right one, not just the fastest one.
When a test score arrives, here is what the research and experience of educators consistently supports:
Read the full report before reacting. Identify what type of score you’re looking at — percentile rank, grade equivalent, or scale score. Each means something different.
Look for patterns, not single results. One test is a snapshot. Compare it to previous scores in the same subject. Is this consistent or unusual?
Talk with your child first. Ask how they felt going into the test, during it, and afterward. Their answer tells you more than the number does.
Contact the teacher with specific questions. Not “Why did they do badly?” but “Is this gap typical for the class? What does their daily work show? Are there signs of test anxiety?”
Focus on growth, not ranking. A child improving steadily from one year to the next is on the right track, regardless of the percentile. A child stuck at a high percentile with no growth is a more concerning picture than it looks. The parents who navigate this best aren’t the most reactive ones. They’re the most curious ones.
Conclusion:
A test score tells you one thing: how your child performed, on this type of assessment, on this day, compared to this group. That’s genuinely useful information — when you read it correctly.
The five mistakes in this guide all come from the same place. They come from treating a number as a verdict rather than a data point.
A 60th percentile is not a C. A grade equivalent of 6.2 for a 4th grader is not a promotion letter. A single low score in October is not a permanent academic trajectory.
Here is what actually matters:
- One score is a snapshot. Three scores showing the same pattern is something to act on.
- Percentile means ranking. Percentage means accuracy. They are not the same thing.
- Classroom performance and standardized scores measure different skills. Both matter.
- Growth over time is more meaningful than any single result.
- Comparing your child to others — siblings, classmates, anyone — shifts their focus from learning to competition. That’s a trade-off worth avoiding.
If a pattern of concern does emerge, the right move is a conversation with the teacher, not a punishment or an emergency tutoring enrollment.
And if you want to understand how any individual score connects to the final course grade. EasyGraderHub gives you that picture in minutes. Sometimes what feels like a disaster barely shifts the final number. Knowing that changes everything.
Your child’s potential is not in the score. But understanding the score is how you help them reach it.
Frequently Asked Questions
What is the biggest mistake parents make with test scores?
The most common mistake is confusing percentile rank with percentage. A 60th percentile score does not mean 60% correct. It means your child performed better than 60% of students who took the same test. Percentiles measure ranking. Percentages measure accuracy. They are completely different numbers, and misreading them causes unnecessary worry almost every time.
What are the three types of scores on a test report — and which should I focus on?
Most standardized test reports include three types. Percentile rank shows how your child compares to peers. Use this for understanding relative performance. Scale score or standard score shows actual learning growth on a continuous scale. Use this for tracking improvement over time. Grade equivalent suggests how performance compares to another grade level. Use this only as rough context, not for placement decisions.
Should I punish my child for a low test score?
No. Punishment consistently backfires with academic performance. It increases test anxiety, reduces motivation, and teaches children to hide results rather than discuss them. A better response: wait 24 hours, ask questions, and approach it as a problem to understand together rather than a behavior to correct.
My child has good classroom grades but low standardized test scores. What does that mean?
This gap is more common than most parents realize. It usually comes from one of three sources: test anxiety that doesn’t show in daily work, curriculum misalignment where the test sequence differs from class lessons, or different skills being assessed such as projects and participation versus timed multiple‑choice recall. The best first step is a teacher conference with specific questions about the gap.
How do I know if a low score is actually a problem worth acting on?
One low score is rarely a problem; a pattern is. Pay attention if you see repeated below‑average results, a sharp drop from past years, or struggles showing up in both classroom grades and standardized tests. When all three signs appear together, it’s time to sit down with the teacher and, if needed, consider a referral to a learning specialist.
Can extra credit or other assignments make up for a bad test score?
Often yes, but it depends on how the course is graded. In most classrooms, grades are weighted by category. A single test might count for 20–25% of the final grade, so strong performance on other assignments can offset it. Extra credit can also help raise the overall score. Before assuming the worst, look at how each category is weighted and how extra credit affects a final grade. That math gives you a real answer instead of a guess.
What is the difference between a grade equivalent score and a percentile rank?
Grade equivalent scores are often misunderstood. A 5.8 grade equivalent for a 3rd grader doesn’t mean they’re working at a 5th grade level. It means they performed the way an average 5th grader would on a 3rd grade test. Percentile rank is more reliable. A 68th percentile means your child scored better than 68% of students who took the same test. For meaningful conversations about performance, focus on percentile rank. Grade equivalent is context only.
Is it harmful to compare my child’s test scores to their sibling’s scores?
Yes, comparing siblings’ scores is harmful. Research on motivation shows it raises anxiety, fuels resentment, and shifts focus from learning to competition. A 54th percentile isn’t “worse” than an 88th; it’s simply a different result for a different child on a different path. The only comparison that matters is your child against their own past performance. Are they growing? That’s the real question.
How do I track whether my child is actually improving over time?
Track progress by comparing the same test over time. For example, if your child takes the MAP assessment each fall and spring, focus on whether the scale score increases, not the percentile rank. Percentiles can stay flat even when learning happens, because all students grow together. Scale score growth is the more honest measure of progress. In high school, understanding how GPA accumulates across semesters is the most reliable long-term indicator. A steady upward trend shows academic performance is moving in the right direction.
What should I say to my child after a disappointing test result?
Start with curiosity, not judgment. Ask how your child felt going into the test and which parts felt hard. Listen first, without rushing to fix it. Then shift the focus to next steps instead of what went wrong. A helpful frame is: “Let’s figure out what this tells us and what we can do about it.” That way the score becomes information, not a verdict. Children who feel supported after low scores are more likely to keep trying, while those who feel judged are more likely to give up.
Olivia Grant is a former K–12 teacher (12 years) and Lead Content Strategist at EasyGraderHub, holding an M.Ed. in Curriculum & Instruction from the University of Washington. She writes EasyGraderHub’s grading guides and reviews its calculators for classroom accuracy. Read more about Olivia.