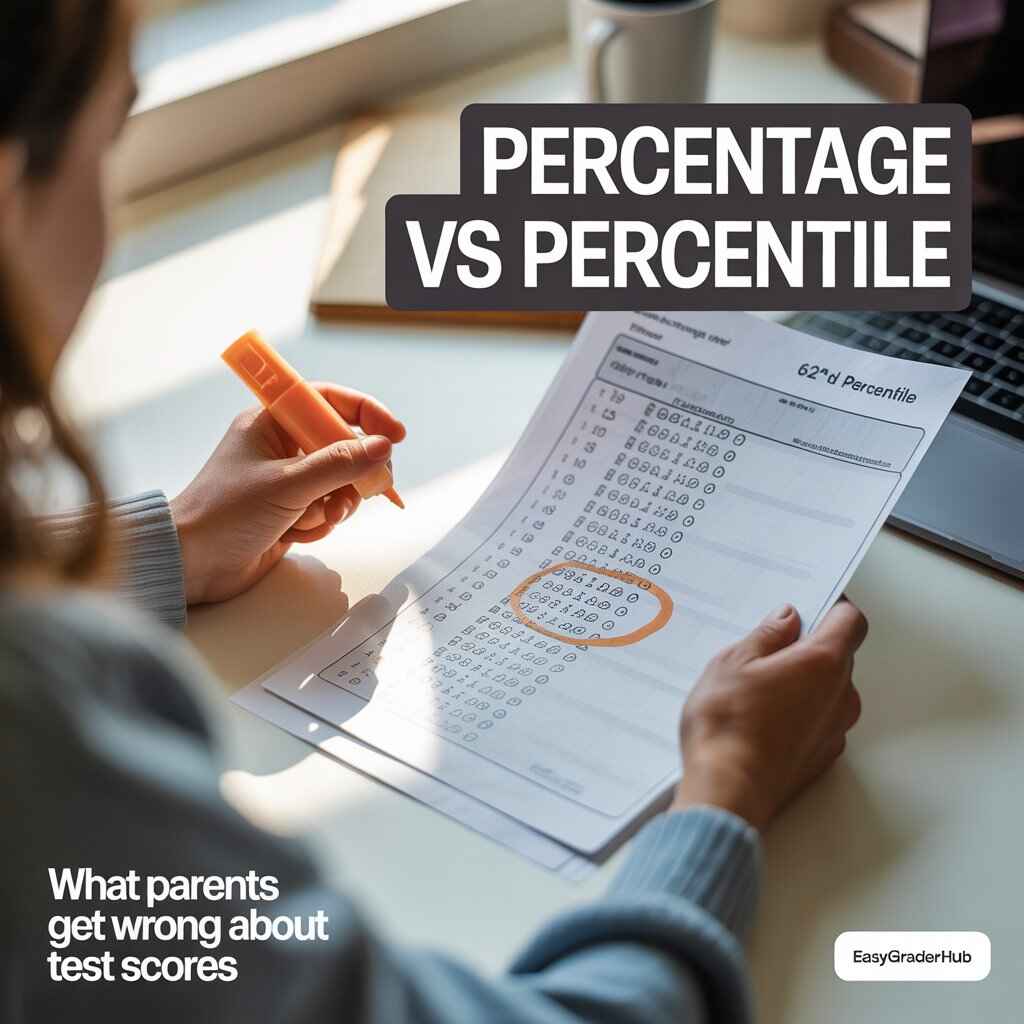
When your child brings home a test report with a “60th percentile,” your heart might sink. Many parents read this like a failing percentage score — but that’s exactly where the confusion starts.
In reality, percentage and percentile report very different things. One shows how many questions were correct. The other shows how your child’s performance compares to others. Misreading these leads to unnecessary worry and incorrect conclusions about performance. Let’s clear this up in simple terms you can use today.
What Percentage and Percentile Really Means?
Percentage:
- A percentage shows how much you scored out of the total marks.
- Formula: Percentage= (Correct Answers ÷ Total Questions) × 100
- Example: If you get 45 marks out of 50, your percentage is 90%.
Percentage tells you how much of the work your child got right.
Percentile
- A percentile shows your position compared to other students. It tells you what percent of students scored less than you.
- Formula (simplified): Percentile=Number of students below you / Total students×100
- Example: If 100 students took a test and you scored better than 85 of them, your percentile is 85th percentile.
A percentile tells you the percentage of people who scored lower than you, showing your rank among others.

Let’s use a real-life style example with numbers so you can clearly see the difference between percentage and percentile.
Example: A Class Test
- Imagine 100 students take the same math test.
- The test is out of 100 marks.
Student A
- Score: 80 marks → 80% (percentage).
- Now, let’s compare with others: suppose most students scored between 50 and 70.
- That means Student A did better than 90 students out of 100.
- So, Student A is in the 90th percentile.
Student B
- Score: 80 marks → also 80% (percentage).
- But in another class, many students scored between 85 and 95.
- That means Student B only did better than 40 students out of 100.
- So, Student B is in the 40th percentile.
What this shows
- Both students have the same percentage (80%).
- But their percentile is very different because it depends on how others performed.
- That’s why in competitive exams, percentile is more important — it shows your rank among others, not just your marks.
👉 In short:
- Percentage = Your score
- Percentile = Your position compared to others
Is Percentile More Important Than Percentage?
Let’s break it down in simple words:
Percentage
- A percentage tells you how much you scored out of the total.
- Example: If a test has 100 marks and you get 80, your percentage is 80%.
- It only shows your marks compared to the maximum marks.
Percentile
- A percentile tells you how well you did compared to other people who took the same test.
- Example: If you are in the 90th percentile, it means you scored better than 90% of the students.
- It shows your rank or position among others.
Real Classroom Example:
If your child scores 80% on a test:
- That’s their percentage — 80 out of every 100 correct.
But if peers also did very well:
- Your child might be in the 50th percentile, meaning half scored better.
- On a tougher test, that same 80% might put them in the 80th percentile.
Which is more important?
- Percentage is useful to know your own score.
- Percentile is more important when you are competing with others (like in entrance exams, job tests, or scholarships).
- For example, two students may both have 80%, but if one is in the 95th percentile and the other in the 60th percentile, the first student is ranked higher compared to others.

Key Points
- Shows performance on the test itself.
- Only your child’s answers matter.
- Doesn’t tell you anything about other students.
Every classroom uses this basic math for daily grading, homework, and test results.
⚡ Which really saves more time — Easy Grader vs Manual Grading: See the time difference
What Percentile Rank Actually Means
Percentile rank explains how your child’s result compares to others.
Imagine lining up every student’s score from lowest to highest. If your child is in the 75th percentile, they scored better than 75% of students who took that test.
Important Distinctions:
- It doesn’t measure correctness (that’s what percentage does).
- Instead, it reflects relative position in a group.
- Percentiles are common on large, norm-referenced tests (like SAT, state assessments).
Real life example:
Sarah scored 85% on her test (percentage), yet she beats 62% of the test-takers (62nd percentile). Marcus scored 65% (lower percentage), but because the test was harder for everyone, he beats 58% of peers (58th percentile).
Side-by-Side: Percentage vs Percentile
| Feature | Percentage | Percentile |
|---|---|---|
| What it measures | Correct portion of total | Relative position among peers |
| Computation | Simple division × 100 | Sorted comparison among all scores |
| Tells you | Your child’s performance | How your child stacks up against others |
| Example outcome | 90% | 62nd percentile |
When Parents Should Worry?
Parents often see a 60th percentile and think “barely passing.” But that’s not how to read it.
Here’s what it likely means:
- 40th–60th percentile → average performance, common and normal.
- 75th+ → above average, shows strong performance relative to peers.
- Below 25th consistently → a sign to look closer, not panic.
Percentile ranks do not indicate failure. They simply show where the student stands in the tested group.
How to Read a Test Report Like a Pro
Break a report into three parts:
- Raw Score – number correct vs total (percentage calculation).
- Percentile Rank – comparison with the group.
- Growth Over Time – how trends shift across tests.
This approach reduces misinterpretation and helps you talk to teachers constructively.
Practical Tips for Parents & Students
- Don’t equate percentile with percentage — they measure different things.
- Use percentage to understand raw ability on that test.
- Use percentile to evaluate competitiveness.
- Look for patterns — isolated highs or lows may not reflect growth.
- Talk to teachers if percentiles and class performance don’t align.
Conclusion:
Many parents confuse percentage with percentile, but they measure different things. Percentage shows how many marks a child scored out of the total, while percentile shows their rank compared to other students. In competitive exams, percentile is more important because it reflects true performance in comparison with peers. Understanding this difference helps parents guide their children more wisely.
Percentage and percentile be can calculated easily using online tools like the Easy Grader and Test Grade Calculator. These calculators help parents and students quickly turn test scores into clear results, showing both marks and ranking. With the right tools, reading exam performance becomes simple, confident, and stress‑free.
Can my child score in the 100th percentile?
No. That’s completely normal.
Percentile ranks usually top out at the 99th percentile. A percentile shows how a student compares to other test-takers. Since your child can’t score higher than themselves, reaching 100% of students isn’t mathematically possible.
👉 If your child is in the 99th percentile, they performed better than 99 out of every 100 students, which is exceptionally strong.
Is the 50th percentile bad?
Not at all. The 50th percentile is average, and average is expected.
It means your child performed better than half of the students who took the same test. Most students fall somewhere near the middle because academic performance typically follows a bell curve.
👉 Being “average” does not mean struggling, it means typical development.
Why did my child’s percentile drop even though their score went up?
This is one of the most confusing — and most common — situations for parents.
Percentiles are relative, not absolute.
For example:
Last year: 75 correct answers → 60th percentile
This year: 78 correct answers → 55th percentile
What changed? The comparison group performed better overall this year. Even though your child improved, other students improved more.
👉 A lower percentile does not automatically mean lower ability or regression.
Are percentiles the same across all tests?
No — and this is critical to understand.
A 70th percentile on the SAT, a state math test, and a classroom reading assessment do not represent the same level of skill.
Percentiles depend on:
Test difficulty
Who took the test
What skills were measured
👉 Always interpret percentiles within the context of that specific test, not across different exams.
What if my child scores below the 25th percentile?
One low percentile score isn’t automatically a red flag.
Everyone has off days, test anxiety, or weak subject areas.
However, if your child consistently scores below the 25th percentile across:
Multiple tests
Multiple subjects
Long periods of time
…it’s worth paying closer attention.
👉 Talk with the teacher about classroom performance, learning gaps, and whether extra support could help.
Should I get a tutor if my child is in the 40th percentile?
Not necessarily.
The 40th percentile is still within the normal range.
Before investing in tutoring, ask:
Is your child struggling in daily classwork?
Do teachers report skill gaps?
Is this score consistent or just one data point?
Is test anxiety affecting performance?
👉 Start with a conversation with the teacher — they see the full picture.
How do I know if a percentile change actually matters?
Small percentile changes are usually normal variation.
Educational experts generally agree:
Changes under 10 percentile points are common
A shift from 55th → 63rd or 72nd → 67th is usually not significant
What matters more:
Long-term trends
Consistent improvement or decline
Alignment with classroom performance
👉 Look at patterns, not single scores.
Is percentile more important than percentage?
They answer different questions.
Percentage tells you how many questions your child got right
Percentile tells you how your child compares to others
👉 Percentages are useful for grading.
👉 Percentiles are useful for comparison and placement.
Understanding both gives the clearest picture.
What should parents focus on more than percentiles?
Percentiles are just one piece of data.
More important indicators include:
Classroom engagement
Skill mastery over time
Teacher feedback
Confidence and attitude toward learning
👉 A child improving steadily is often doing better than a child with a higher but stagnant percentile.
Olivia Grant is a former K–12 teacher (12 years) and Lead Content Strategist at EasyGraderHub, holding an M.Ed. in Curriculum & Instruction from the University of Washington. She writes EasyGraderHub’s grading guides and reviews its calculators for classroom accuracy. Read more about Olivia.